Most B2B SaaS at €2M–€10M ARR have a landing page conversion rate of 1–2%. The top performers sit at 5–8%. This gap is not a traffic quality problem. It is a structural page problem that no amount of ad spend can fix, and these conversion rate benchmarks prove it.
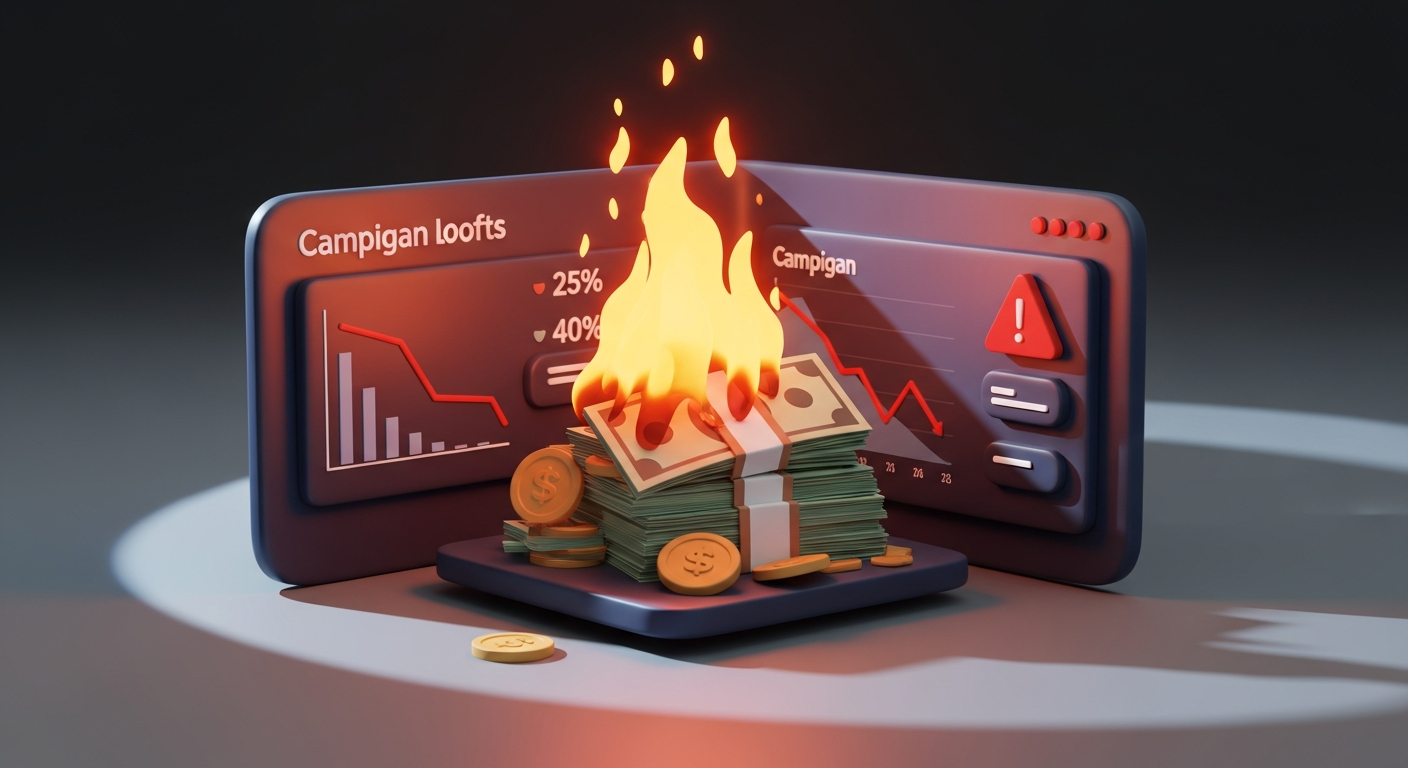
If your primary landing page converts at 1.5% instead of a viable 5%, you are throwing away more than two-thirds of your qualified traffic. For a team spending €20k per month on paid acquisition, that is over €13k of wasted budget every single month, or €156k per year. This waste directly inflates your cost-per-SQL and extends your CAC payback period beyond what is sustainable.
This is not just a marketing metric. It is a financial one that has board-level visibility. A low conversion rate forces you to justify a larger budget to hit the same pipeline target. Your CEO sees a leaky funnel, and the board questions the efficiency of the entire go-to-market motion. The problem is rarely the traffic source. It is the asset that traffic lands on.
The First-Impression Audit: A Structural Diagnosis, Not a Copywriting Test
Before you spend another euro on A/B testing headlines or button colours, you need to diagnose the page's structural integrity. The First-Impression Audit is a scoring system to do this. It audits five elements a visitor must see immediately upon landing, without scrolling. Score each from 0 (missing or weak) to 2 (clear and present). A total score below 8 out of 10 indicates a foundational issue that new copy cannot solve.
1. Clarity: Can a visitor understand what you do in five seconds?
This is not about a clever headline. It is about an unambiguous statement of value. It answers the question "What is this?" instantly. Jargon, marketing fluff, and abstract nouns are immediate failures. The test is simple: show the page to someone unfamiliar with your product for five seconds, then hide it. If they cannot explain what the product does and for whom, you score a 0 for clarity. A clear page states the what, who, and why without ambiguity.
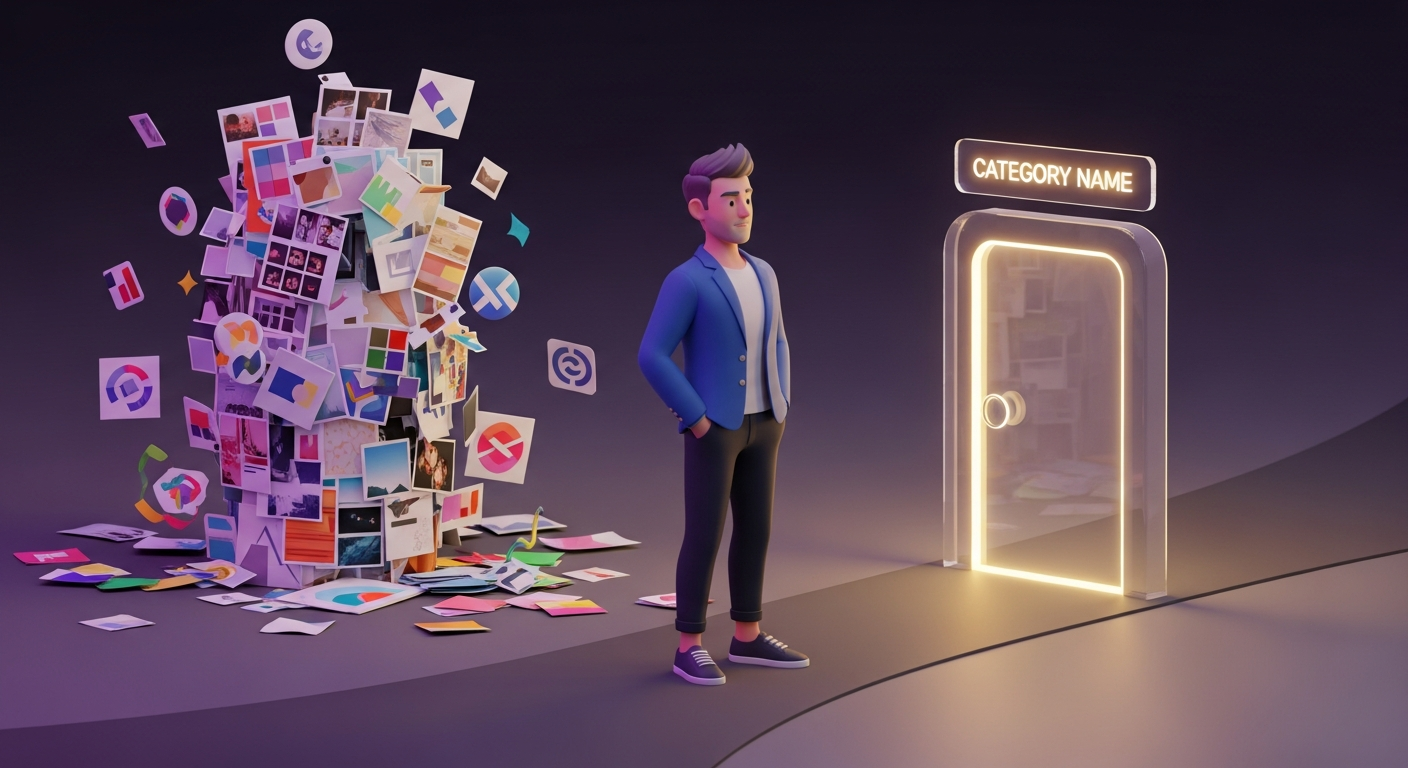
2. Target: Does the page speak to a specific ICP?
A page built for "everyone" converts no one. The copy, imagery, and offer must align with a single, well-defined Ideal Customer Profile. If your page for a CFO uses the same language and value propositions as your page for a Head of Engineering, it is failing this test. The visitor must feel that the page was written specifically for them, addressing their unique role, industry, and challenges. Generic stock photos and broad statements are signs that the target is not defined and an undefined target guarantees a low conversion rate.
3. Problem: Does the copy reflect the buyer's actual pain?
Your bsources for this language are not internal marketing brainstorms; they areuyers are not looking for your product. They are looking for a solution to their problem. A high-converting page moves beyond feature lists and articulates the buyer's pain point using their own language. The best source for this language is not an internal marketing brainstorm, it is sales call recordings, support tickets, and customer interviews. A page that lists what your software does without connecting it to a quantified business problem scores low here. It shows you understand your product, but not your customer.
4. Proof: Where is the evidence that you solve this problem?
This is the most common failure point for B2B SaaS landing pages. Proof is not a carousel of client logos. It is a specific, quantified result that demonstrates you have solved this exact problem for a similar company. Case studies with hard numbers, testimonials that mention a specific metric, and third-party validation are strong forms of proof. A vague quote is not.
For example, when we started working with a European identity-verification SaaS, they operated in a brutally crowded category with disconnected marketing campaigns. We rebuilt their growth motion as a single Revenue Engine, designed so every euro spent could be traced to a deal. Within three months, the new system generated €475k of qualified pipeline and €30k in closed new revenue. That specific, quantified proof, placed where a visitor sees it without scrolling, answers the core question: "Has this company solved this problem for someone like me?"
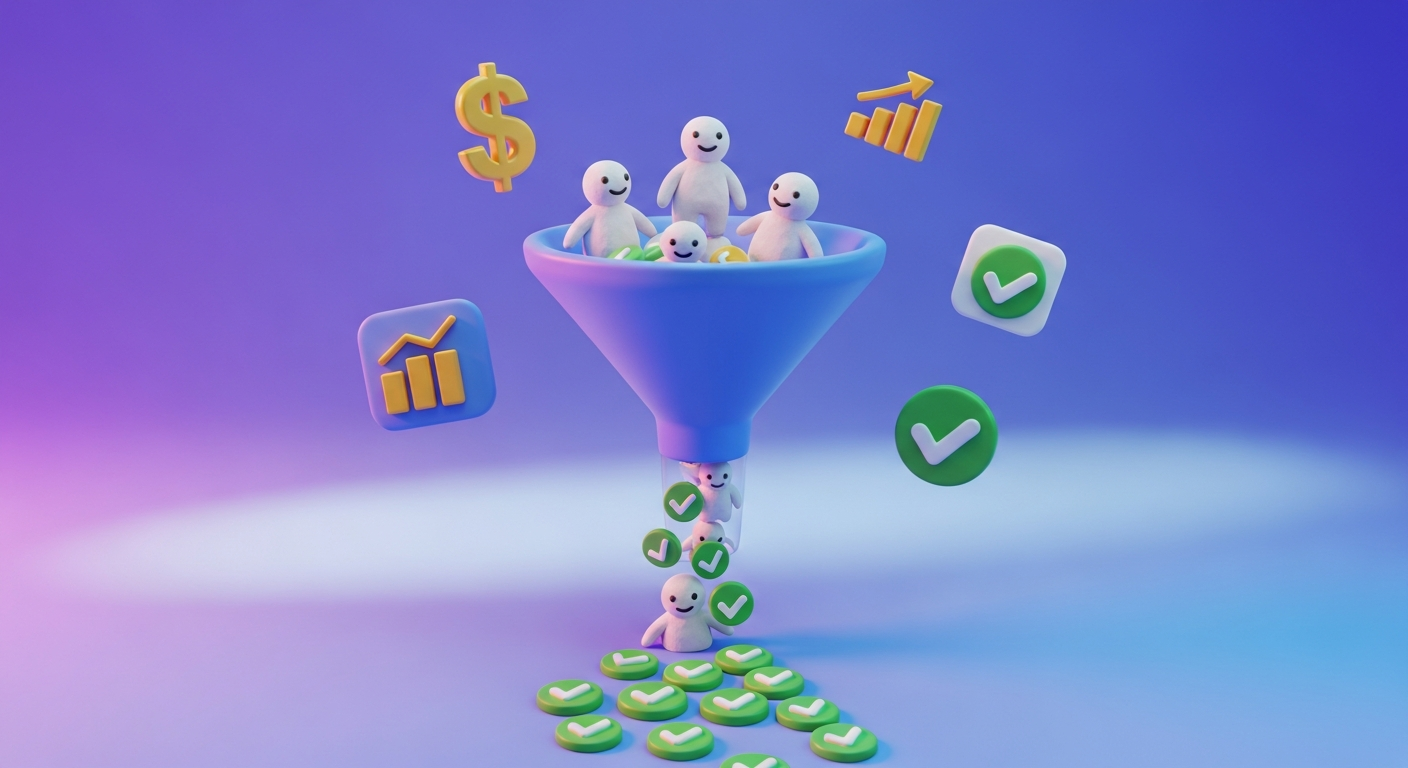
5. Action: Is the next step obvious and low-friction?
The call-to-action must be a single, clear instruction. "Request a Demo" is better than "Learn More." The visitor should never have to think about what to do next. The action must also be low-friction. A 10-field form to book a demo is a conversion killer. Every field you add reduces the completion rate. Audit every click, input, and thought required to get from landing page to completed conversion. A simple email field connected to a calendar booking tool is a low-friction flow that respects the visitor's time and increases the likelihood they take the desired action.
What the Numbers Look Like When You Fix the Page Before Scaling the Budget
The First-Impression Audit is a diagnostic tool, not a growth lever by itself. The real work is applying it to your own landing pages, ad creative, and CRM data to find where qualified traffic is dropping off. Here is what that looks like in practice.
A Vienna-based proptech startup came to us at pre-revenue with no brand, no funnel, and no sales process. They needed to enter a new market and generate qualified pipeline from zero. Rather than running paid traffic to a generic holding page, we built the full commercial infrastructure first: a brand that qualified buyers would take seriously, a landing page that passed all five First-Impression criteria from day one, and a conversion flow designed around a single low-friction action.
Six weeks after going live, the result was €2.04M in MQL value and €165k in qualified deal pipeline on under €2k in total ad spend. That is over €80 of qualified pipeline for every €1 spent. The ad spend was not exceptional. The page was.
The same principle applies when you are scaling an existing programme. If your landing page scores below 8 on the First-Impression Audit, adding budget does not help, it amplifies the leak. Fixing the structural page problem first, then scaling spend, is the order that produces a defensible CAC payback number.
What Each Gap Actually Costs You
Once you have scored your page, the weaknesses become actionable. A weak Clarity score means your paid traffic is bouncing before the message lands. A weak Target score means your copy is doing nothing to pre-qualify intent, you are paying for clicks from people who were never going to convert. A weak Proof score means even the right visitor leaves unconvinced.
The relationship between page quality and paid efficiency is direct. Every point of structural weakness in the page is a multiplier on wasted spend. For a team running €20k per month on acquisition, a page converting at 1.5% instead of 4% means you need 2.7x as many clicks to hit the same pipeline target - at 2.7x the cost. The page fix pays for itself before the next billing cycle.
Where to Start
If your conversion rates are stuck and the audit above has surfaced two or three structural gaps, the next step is a Revenue Leak Audit. It maps the drop-off points across your full funnel, landing pages, CRM handoff, lead qualification, attribution, and produces a prioritised fix list ordered by pipeline impact.
If your page is converting below 3% and you are spending on paid acquisition, the audit will almost certainly show the page as the primary leak. Fixing it before the next media spend cycle is the highest-leverage move available to you right now.
Book the Revenue Leak Audit here: https://calendly.com/dimartec/plug-your-revenue-leaks


.png)
.png)
.png)
.png)
.png)
.png)
.png)
.png)
.png)
.png)