Five per cent activation in a new SaaS onboarding flow is not a win. It is a warning shot. Median landing-page conversion for B2B SaaS between €2M and €10M ARR sits at 1–2%, but the first-14-day drop-off is where most teams lose the pipeline they paid to acquire. Lift activation above 8% and CAC payback periods drop by quarters, not months.
After analysing more than 200 B2B SaaS sign-up landing pages, the pattern is consistent: getting a page from 2% to 5% conversion is the easy part. A copy rewrite, a clearer CTA, or a faster-loading page will usually get a team there. Getting from 5% to the 8–10% ceiling almost never happens through copy alone. In our dataset, every page that crossed that threshold had fixed the same five structural issues described below, and no page fixed fewer than four of them and still crossed it.
Most drop-off is not a product problem. It is a structural marketing problem: unclear messaging at the point of entry, a signup journey with too many steps, and no compelling proof where the visitor is making their decision. The gap between 2% and 6% activation is almost always fixable. But it requires diagnosing the architecture, not running another A/B test on a button colour.
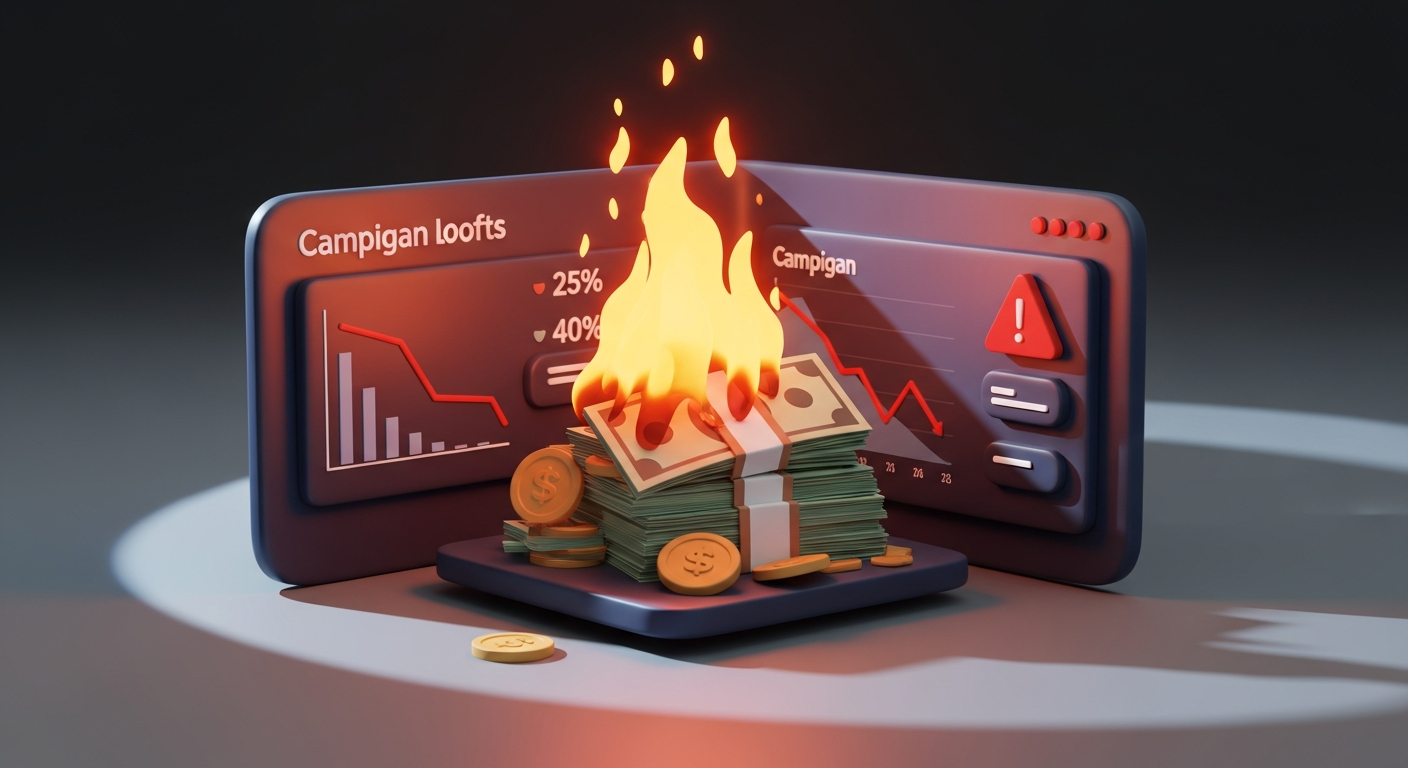
The maths are unforgiving. For a B2B SaaS spending €10k per month on paid acquisition at a 1.5% landing-page conversion rate, over €8k of that budget is lost before a single lead reaches the CRM. A lift to 5% means each euro of ad spend works more than three times harder, without changing the bid or the audience. That is why onboarding conversion is not a product team metric. It is a commercial one.
What Good SaaS Onboarding Actually Looks Like
Good onboarding is not a welcome email sequence or a product tour. It is the full journey from first click to a user completing an action that signals genuine intent: a demo booked, a trial started, a qualification form submitted. Every step in that journey either earns the next click or loses it. The teams that get this right treat the onboarding flow as a conversion system, not a UX project.
That means taking ownership of three things simultaneously: the message a visitor arrives with, the friction they encounter between landing and converting, and the qualification logic that determines what happens after they take an action. Most SaaS teams own one of these well. Almost none own all three.
The Five Steps That Separate High-Converting Onboarding from Low-Converting Onboarding
Step 1: Match the Landing Journey to the Traffic Source
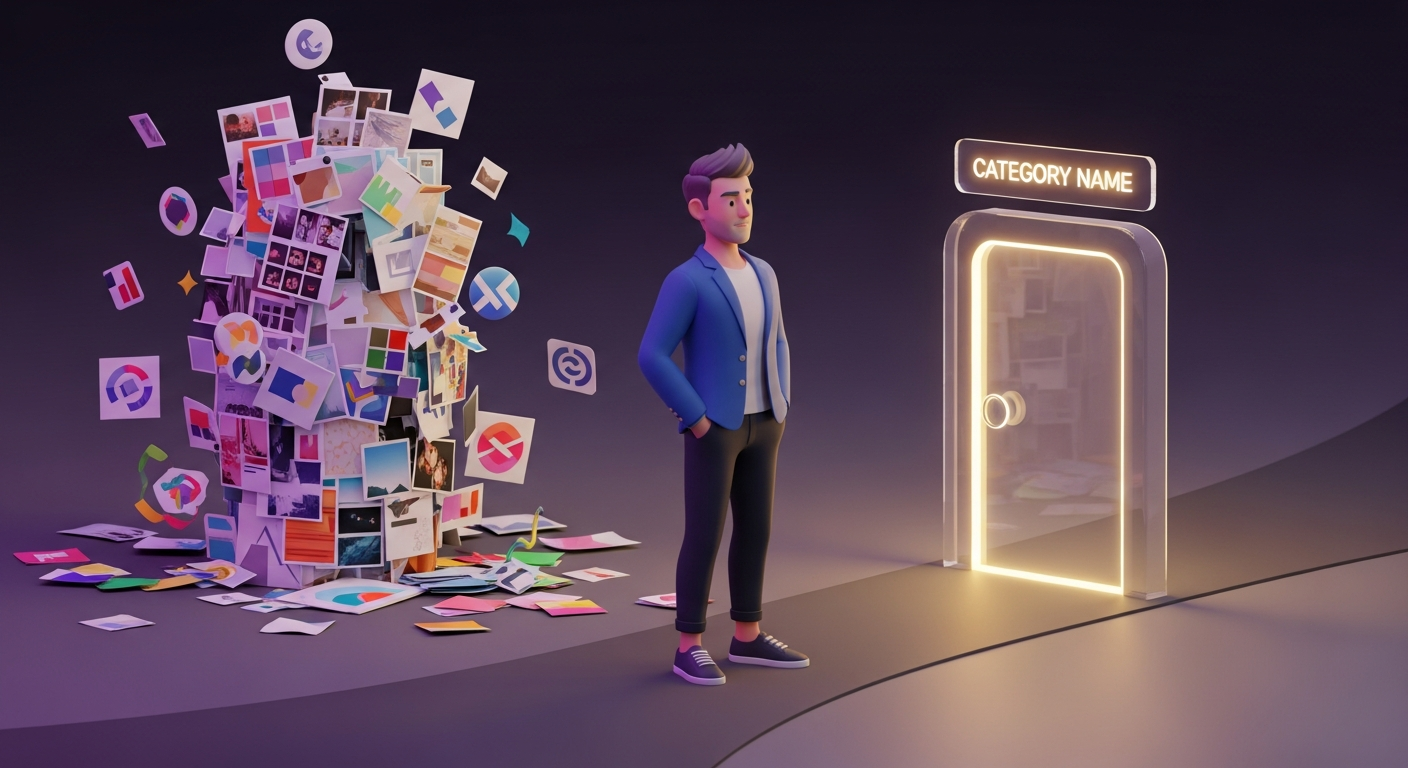
Every channel brings a different visitor with a different level of intent and a different context. A visitor arriving from a branded search term is much closer to a decision than one arriving from a content piece about a broad industry topic. When both land on the same generic homepage, the high-intent visitor finds a page that does not confirm what they already believe, and the low-intent visitor finds a page that asks for more commitment than they are ready to give.
Across the pages in our dataset, source-to-page mismatch was the single most common issue, present on 61% of underperforming pages. Branded search traffic landing on a generic homepage converted at roughly a third of the rate of the same traffic landing on a page written for that specific intent.
The fix is to audit every channel driving top-of-funnel traffic and calculate its conversion to a landing-page action. Segment by source: paid search, organic, direct, partner referral, social. Identify the sources with sub-1% conversion. For each, the question is the same: is the page the visitor lands on built for the intent they arrived with? If the answer is no, that is where the budget is leaking.
Step 2: Audit the Page Against Five Structural Criteria
Before any iterative testing, every landing page in the onboarding flow needs to pass a structural check. Assign one point per criterion. A score below 4 out of 5 means the page needs rebuilding before any test is worth running.
Clarity: Is what the product does explicit within the first few words, without jargon?
Target: Is it immediately clear who the product is built for?
Problem: Is the reason to act now stated directly, in the visitor's language?
Proof: Are specific, quantified results or recognisable client names visible without scrolling?
Action: Is there one single, unmissable next step, with no competing options?
A page scoring 3 out of 5 does not need a new headline. It needs a structural rethink. New copy on a broken architecture produces marginal gains at best and masks the underlying problem. In our sample, pages scoring 4 or 5 on this audit converted on average more than twice as well as pages scoring 2 or below, regardless of traffic source or industry vertical.
Step 3: Remove Friction from the Signup and Demo Flow
List every required field, decision, and click between landing and a completed conversion. The consistent loss points across B2B SaaS onboarding flows are well-documented: multi-stage forms with non-essential fields, pricing that requires a conversation to understand, unclear trial options, and no progress indication between steps.
Each unnecessary form field costs roughly 10–15% of completion rate per step. Cut the bottom third of form fields and the typical result is a 20–30% lift in completion rate. Forms with 3 fields or fewer in our dataset averaged completion rates close to double those with 7 or more fields, even when the additional fields were framed as optional. The principle is simple: every step you add is a decision point where the visitor can leave. Audit every step against one question: does removing this cost more than keeping it?
Step 4: Qualify Intent Before the Sales Handoff
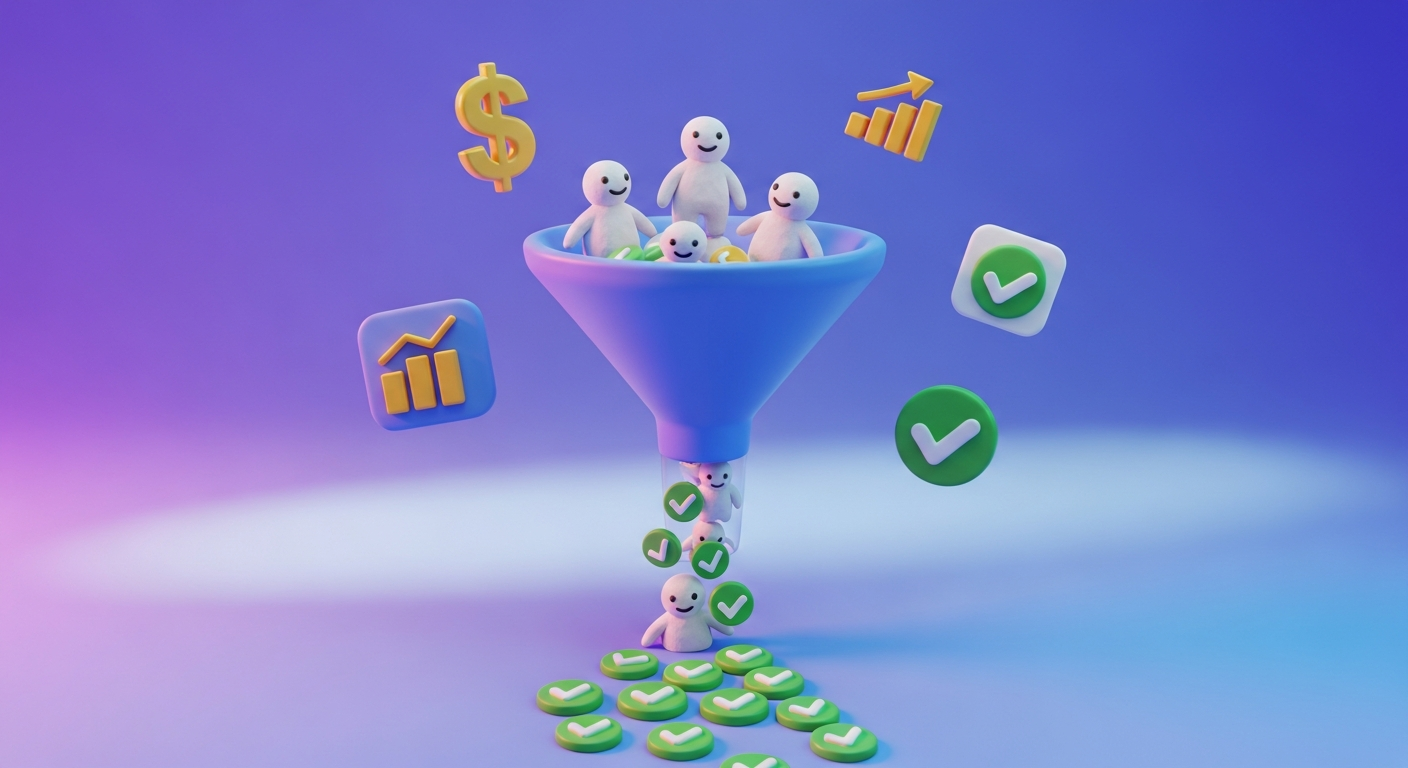
High-performing SaaS onboarding flows segment visitors before they reach a sales action. One or two qualification questions covering company size, role, or use case, placed before a calendar booking or access request, serve two purposes. They fast-track genuinely high-intent visitors directly to sales and route everyone else into a nurture sequence designed to build intent before they are handed over.
Without this step, all conversions funnel into the same queue and sales velocity suffers. Representatives spend time on leads that are not ready. High-intent visitors wait longer than they should. Demo-to-SQL rates above 50% are only consistently achievable when intent is assessed and routed before the sales touch happens. This was the step most often skipped entirely: fewer than a third of the pages we reviewed had any qualification logic in place before the booking step, regardless of company size or funding stage.
Step 5: Build a Repeatable Drop-Off Tracking System
Connect CRM data, product analytics, and ad platform data into a single view. Track conversion at every stage: visitor to signup or demo booked, signup to completed onboarding sequence, onboarding to first meaningful product action, and activation to a sales-qualified lead. Run a monthly review of where the drop-off is occurring and by how much.
If the same stage is losing visitors in two consecutive reporting cycles, treat it as a structural signal and rebuild that stage from the friction inventory. The teams that compound onboarding improvements are not the ones running the most tests. They are the ones fixing the right stage based on actual conversion data, and then tracking whether the fix holds.
In Practice: What Engineered Onboarding Produced for a B2B Payments Company
The principle that engineering out friction and qualifying intent before it reaches sales cuts cost per conversion is testable. A founder-led B2B payments company selling cross-border payment solutions to mid-market firms across Europe had no acquisition system. Every unqualified lead that reached the founder cost real time in a low-margin product. The brief was clear: build an engine that filtered paid traffic and outbound into qualified, compliance-screened buyers before they reached a sales conversation.
The acquisition engine was built in 30 days. Every step between ad click and calendar booking was audited against the friction criteria above. Non-essential steps were removed. Qualification logic was built into the flow before any sales touch. The result at five months: 40 new B2B clients at a €213 cost per acquisition on €8.5k of total ad spend, a 7.41% CTR close to double the industry benchmark, €600k of projected lifetime revenue, and a 3,000% ROI on total spend. Drop-off was designed out at every stage. That is what made the numbers possible.
Why Onboarding Improvements Have a Ceiling When They Run in Isolation
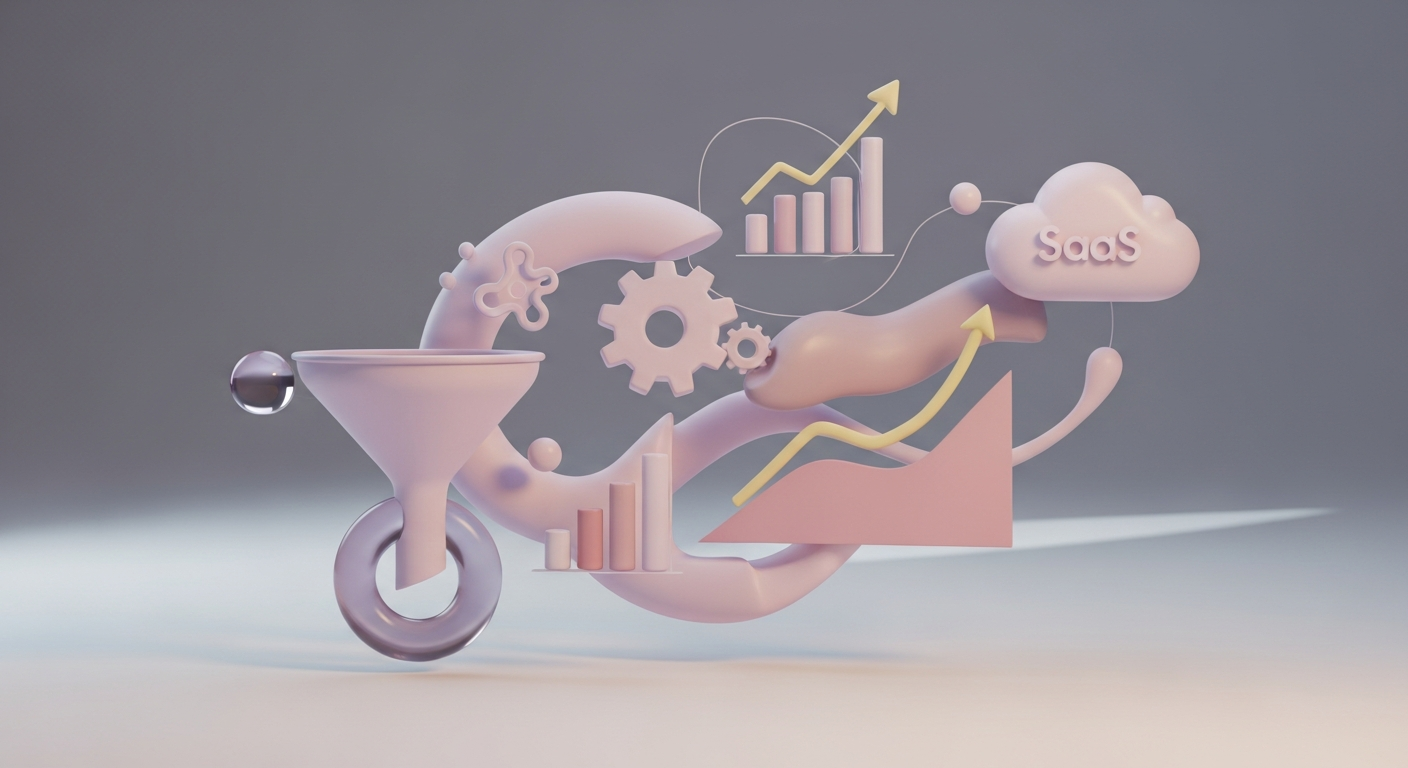
CRO and onboarding improvements compound when they are connected to the channels driving the traffic and the RevOps layer attributing the outcomes. A landing page that converts at 5% still leaks pipeline if the paid campaigns pointing at it are targeting the wrong intent tier. A qualification flow that works well still loses leads if the CRM handoff drops them before a sales representative touches them.
The full onboarding conversion problem spans paid media, page structure, qualification logic, lead routing, and attribution. Fixing one without the others produces short-term gains that plateau quickly. This is consistent with what we saw across the 200-plus pages: the small number that crossed from 5% into the 8-10% range had all fixed the structural issues above as one connected change, not as a sequence of separate experiments run by different teams over several months. The teams that close the gap between their current activation rate and the 8% threshold consistently are the ones treating the entire funnel as one connected system, not a set of separate workstreams owned by different functions.
If onboarding conversion is stuck and isolated fixes are not moving the pipeline number, the Revenue Engine is where the structural work starts.
See how it works: https://www.dimartec.co.uk/services/revenue-engine


.png)
.png)
.png)
.png)
.png)
.png)
.png)
.png)
.png)
.png)